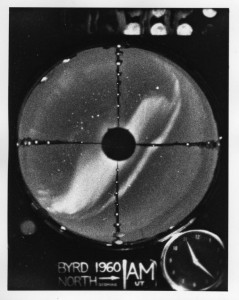
Henry Brecher has studied the polar and icy regions of the world since 1960, when he was hired to be an aurora observer at Byrd Station, Antarctica. This station had been built at a location where scientists thought the aurora australis, or southern lights, would be most visible. Halley Research Station, part of the British Antarctic Survey located on the Brunt Ice Shelf, was also positioned to provide opportunities for auroral observations.
Researcher: Henry Brecher
University/Organization: Byrd Polar Research Center at The Ohio State University
Research Location: Columbus, Ohio (and Antarctica!)
What Are Auroras?
Auroras are natural “light shows” that occur where charged particles from the Sun (referred to as the “solar wind”) are drawn into and spiral through the atmosphere, attracted by Earth’s magnetic field. You can observe a good model of Earth’s magnetic field if you spread some iron filings on a sheet of paper and then hold a bar magnet under the paper. The iron filings will align themselves in a series of arcs. This pattern illustrates the force fields of Earth’s magnetic field very well.
While it is commonly believed that the aurora only happens during the night and in the polar regions, this isn’t true. During the periods of full darkness (the polar winter), the auroras are very apparent, but they also happen during the daylight hours. Scientists had predicted this, but daytime auroras weren’t observed until satellites were able to capture images from space.
By making careful observations and keeping good records more than 100 years ago, scientists calculated the frequency with which auroras would be predicted to occur over measured distances from Earth’s geomagnetic pole. As you can see in the diagram below, the auroras are seen most frequently closer to the polar regions. From this diagram, you can also see that people who live far from the polar regions would not get to see auroras except in unusual circumstances.
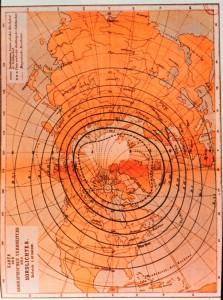
- Late nineteenth-century map showing extent of observation of Aurora borealis. Image courtesy of Collection of Dr. Herbert Kroehl, NGDC. National Oceanic and Atmospheric Administration, Department of Commerce.
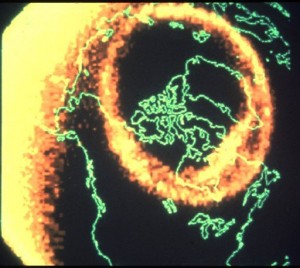
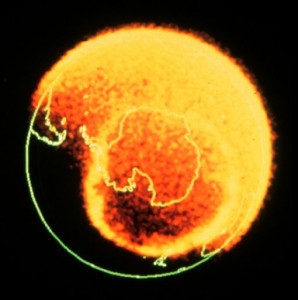
The area of most frequent and concentrated auroral events, called the “auroral oval,” is not centered over Earth’s geographic pole (the North Pole as marked on a globe, where the lines of longitude converge). Instead they are centered over Earth’s geomagnetic pole, which is the point on Earth’s surface above the natural magnetic field. Earth’s magnetic field is generated when the iron core (surrounded by a hot, fluid ocean known as the outer core) spins at a rate different from Earth’s rate as it rotates. Because of this, the magnetic field doesn’t line up with the axis of rotation (the geographic North Pole). Instead, the geomagnetic poles wander over time depending on the rate and direction of spin of the core. The auroral oval is centered over the geomagnetic pole, in both hemispheres.
Why Do We See Colors?
The colors we see in the auroras are the result of which atmospheric gas is being energized by the incoming particles of the solar wind. For example, if the particles energize an oxygen molecule, it gives off a light green or greenish-yellow color. If the particles energize a nitrogen molecule instead, a bluish-purple or bluish-pink color is given off. Henry reported that the auroras he observed were predominantly greenish-yellow.
The same principle, energized gases, is at work in neon lights. Differently colored neon lights are created with different gases in the tubes. The type of gas that is heated or energized gives off light of specific wavelengths.
When Were Auroras First Described?
Auroras have always been a part of the mythology of the northern cultures. Many people feared the lights in the night sky, often linking them to their ancestors or to an angry deity. But the basic physical principles (energy transfer and magnetic forces) and the geographic occurrence of auroras are natural phenomena. One of the earliest known references to the northern lights as a natural phenomenon is found in a book titled King’s Mirror, from about 1230 CE (Common Era), which was written as a textbook for Norway’s young King Magnus Lagabote.
Since then, studies of the aurora have progressed from observation and description by explorers, such as Sir Douglas Mawson, who recorded daily observations during the Australasian Antarctic Expedition from 1911-1914, to modern studies such as those conducted at the Geophysical Institute at the University of Alaska Fairbanks, and current projects that are part of the 2007-09 International Polar Year. The newer technologies rely on the same principles but are more sensitive and finely tuned, able to record and store more data, and in use at more locations (both from space and on the ground).
How Do Scientists Study the Aurora?
Henry had been taught three methods to describe and record periods of auroral activity: a spectrograph, an all-sky camera, and visual observations. The spectrograph is an instrument that is used to determine the exact wavelengths of light (in Angstrom units) being emitted from the aurora. This is known as “emission spectroscopy,” and is used by astronomers to identify the heated gases in stars. Chemistry teachers like to demonstrate this property of gases by having students conduct “flame tests” in the lab, or by using gas tubes that are like neon lights. When energy is supplied to the tube, the gas inside glows. The color that is emitted is a characteristic of the type of gas inside, and can be used to identify that specific gas.
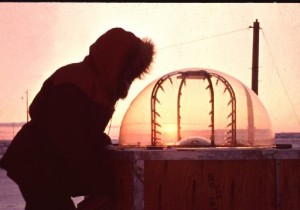
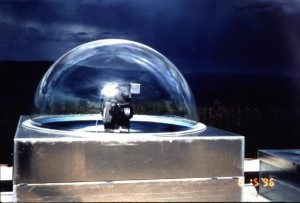
The all-sky camera was used to produce circular images of the entire sky and reflect the movement of the aurora. Placed beneath a hemispheric (domed) mirror, the camera took a picture of a reflection of the surface of that mirror. The camera could be set to take pictures in a time-lapse mode. For example, it could be set to take pictures 15 minutes apart. The dome was heated, and would frost over very quickly if the energy supply was lost. When the dome was frost-covered, the camera took pictures of a frosty dome, but none of the auroral reflections could be seen.
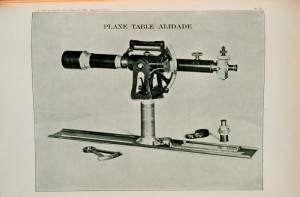
One part of the visual observation process was to describe the position, size, and duration of the aurora. An alidade, a tool somewhat like a surveyor’s transit (the instrument used to measure and define areas of land), was used to measure the angles from the horizon to the bottom and top of the aurora as well as the width of the aurora.
Henry was in Antarctica in the austral (Southern Hemisphere) winter, when it is dark all the time. As a result, the aurora events, which can last anywhere from 30 minutes up to 3 hours, could be visible anytime. Someone, Henry or another observer, had to be on aurora watch around the clock. Henry communicated the data and notes about his job in a written report that was sent to the researchers back in the United States. These written reports helped scientists understand the aurora better.
What Are We Learning about Auroras Now?
Research during the International Polar Year (IPY) includes a project known as ICESTAR, with scientists from 22 countries who are studying how plasma and magnetic fields from the Sun affect near-Earth space and our atmosphere. The solar flares, plasma, and solar wind that result in the auroras are collectively known as “space weather.” The impacts of these phenomena on our satellites, on the ground-based systems that we use to study weather and climate, and on weather and climate themselves are areas that scientists are trying to understand.
Another IPY project will enable astronauts onboard the International Space Station to observe the aurora and other atmospheric effects at the same time that scientists who are stationed in the polar regions are making observations from the ground.
Other scientists from Russia, the United States, United Kingdom, and Australia are collaborating to investigate the extent to which variability in the Sun’s output affects Earth’s weather and climate. For this IPY project, instruments are being set up on the Antarctic Plateau and in Greenland.
While auroras are much better understood now than they were when Henry worked as an observer, they still fascinate and intrigue people around the world. The continued interest in the auroras and the improved abilities to study them lead to even more questions.
Since his role as an auroral observer, Henry Brecher has worked at the Byrd Polar Research Center at The Ohio State University, where he uses photographs to measure changes in the size and position of glaciers. Making measurements from photographs is known as photogrammetry.
This article was written by Carol Landis. For more information, see the Contributors page. Email Kimberly Lightle, Principal Investigator, with any questions about the content of this site.
Copyright May 2008 – The Ohio State University. This material is based upon work supported by the National Science Foundation under Grant No. 0733024. Any opinions, findings, and conclusions or recommendations expressed in this material are those of the author(s) and do not necessarily reflect the views of the National Science Foundation. This work is licensed under an Attribution-ShareAlike 3.0 Unported Creative Commons license.

