Jason Box is a research scientist at Ohio State University. He is researching the ponds and lakes that form on the surface of the Greenland ice sheet in the summer season. Studying these bodies of melted snow and ice (meltwater) helps scientists understand the behavior of glaciers and their response to the changes in climate.
Researcher: Jason Box
University/Organization: Byrd Polar Research Center at The Ohio State University
Research Location: Columbus, Ohio, and Greenland
Big Ice
An ice sheet is a mass of glacier ice that is greater than 20,000 square miles. Today, Greenland and Antarctica are home to the two remaining ice sheets on the earth; both sheets cover a significant portion of each land mass. Approximately 81 percent of Greenland and 98 percent of Antarctica are covered with glacier ice.
These ice sheets are cold, remote, and dangerous areas, which can be dark most of the winter (up to half of the year). As a result, scientists have had limited opportunities to directly observe and map the ice sheet or get frequent surface measurements from hard-to-traverse areas. Scientists need as much data as possible to develop numerical models about the forces and processes that are interacting above, within, and under the ice. These models are particularly significant as the climate warms, accelerating the loss of ice from the margins of each sheet.
Satellite and other remote-sensing technologies are necessary to understand the big picture because they allow simultaneous measurements of large areas. Satellite observations are also helpful because they can provide timed photographs and images that can be compared to assess the extent and rates of changes. Other important components of understanding the big picture are on-the-ice-and-water observations of Greenland’s glaciers by researchers like Jason Box.
During the sunny summer months, intense solar radiation causes pools of meltwater to form ponds and lakes on the ice sheets. These melt ponds and lakes can be quite large. To put the word “ponds” in perspective, see this photo and video clip of Jason crossing one of the ponds in an inflatable dinghy.
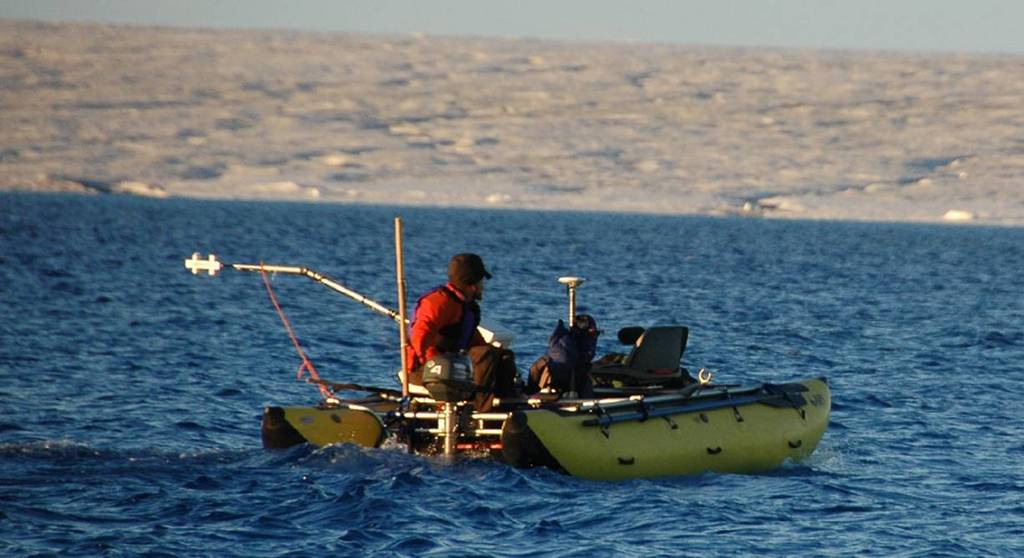
Jason Box crosses a melt pond in an inflatable dinghy. Photo courtesy of Jason Box.
The summer melt ponds on the surface of Greenland’s ice are fascinating to Jason. He’s interested in what happens to the water in the melt ponds.
Mysterious Melt Ponds
These pictures of the Jakobshavn Glacier in western Greenland were taken in the summer season of 2003. Which picture do you think was taken early in the summer?
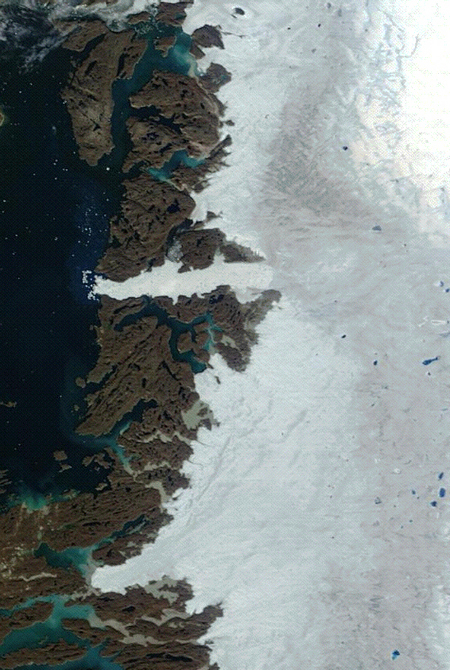
Jakobshavn glacier (the ice margin of western Greenland) 2003. NASA MODIS imagery, processed by Jason Box, Byrd Polar Research Center.
It would be logical (and correct) to suppose that the blue dots are melt lakes or ponds that appear in the spring and summer and are caused by the intense solar radiation. It is also logical to predict that more water would accumulate on the surface as the summer goes on. However, that’s not entirely true. As always, it’s more complex than that.
Glacial melt lakes can suddenly and quickly drain and disappear. From satellite images and monitoring devices, glaciologists observed a melt lake on the Greenland ice sheet drain in less than 48 hours! In April 2008, a team of scientists from Woods Hole Oceanographic Institution and the University of Washington reported that most of the meltwater in a lake more than two miles long and 40 feet deep drained in less than 90 minutes in a cascade larger than the Niagara Falls! How can this happen?
Moving Through Moulins
Scientists believe that the weight of the water in a melt pond exerts enough force on the surface of the glacier to cause a crevasse (krih-voss’), or deep crack, to open. The crevasse is quickly filled by water from the pond. As the water moves downward, its turbulence and heat bores a shaft, called a moulin (moo-lawn), into the ice sheet. Moulins range in size and can be as wide as 10 meters (33 feet) across.
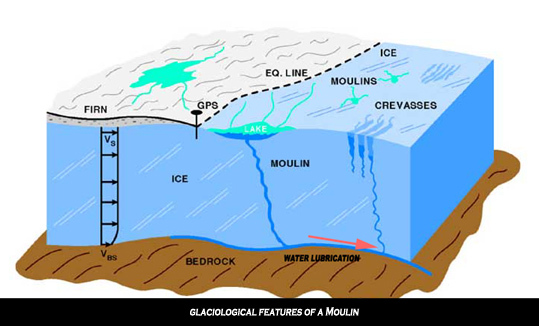
A cross-section of a glacier showing the features of a moulin. Image courtesy of http://www.global-greenhouse-warming.com/.
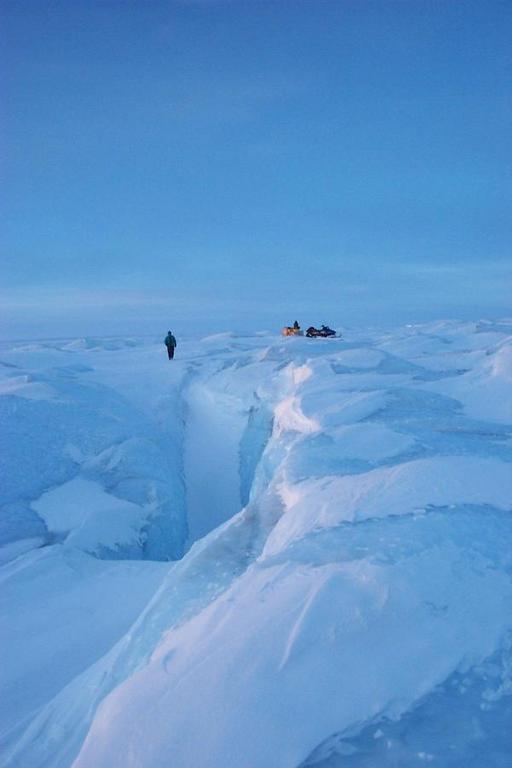
A moulin, or an opening in an ice sheet. Photographed by Dr. Jason Box, a researcher from the Byrd Polar Research Center at The Ohio State University.
Meltwater Matters
Scientists like Jason are interested in where the meltwater ends up. Does the water refreeze at some point as it travels through the ice, or does it remain liquid and travel all the way to the bedrock below?
In 2006, scientists lowered cameras into the water as it drained into a moulin to answer that question. However, the camera equipment they had at that time could only go down 100 meters (about 328 feet), so the complete answer still eludes us.
Scientists know that some of the meltwater is able to flow all the way to the base of the glacier, where it can have significant effects on the glacier’s behavior.
Liquid water is denser and more fluid than ice. As it flows downward, it can enter and fill open spaces in the ice. If the water drains beneath the ice, it can reduce the friction with the rocks below, causing the glacier to slip more easily along the bed and surge forward.
A layer of water under the base of the glacier (the part in contact with the land surface) can also change the speed of the glacier in another way. If enough water drains below the ice, the water can lift the ice off the bed. This changes the amount of resistance acting on the ice. The change in pressure (from the bottom to the sides) exerts new stresses on the body of the glacier. The change in the direction and force of these stresses may weaken the structure of the glacier.
Also, just as the Gulf Stream delivers warm water northward along the east coast of the United States toward the North Atlantic Ocean and Europe, the meltwater draining into a moulin delivers some amount of heat energy deep into the glacier. This heat energy can have an impact on the movement of the glacier.
An animation (with captions) from the Woods Hole Oceanographic Institution’s Polar Discovery site shows how this “plumbing system” works.
The Bottom Line
The “glacial pace” of advancing or retreating ice sheets is often assumed to be in the range of inches per day or feet per year. However, due to climate change, some glaciers are now surging at 20 meters (65 feet) per day. To capture this information as data, Jason is placing “glacier cams” around Greenland. Photos from the glacier cams have allowed him to determine the rates and direction of movements that were not detectable from satellite images. For example, the photos allow his team to measure changes in the position of a boulder that is traveling on the surface of a glacier. Running the photos in a time-lapse mode gives a much better appreciation of the rates of motion of these glaciers.
The multiple interactions occurring in and around glaciers are not easily seen or detected, and therefore are hard to model. New data enable scientists to refine the models. As the scientists obtain more direct measurements of glaciers and gain more computing power to process the data, the models will continue to evolve.
The water cycle is a natural phenomenon that is readily understood. However, it is still difficult to mathematically describe the amounts of water in the different phases and places in the earth system. The rapid changes that are being observed in the ice sheets and glaciers were not built into the earlier climate change models. As a result, this new information is already reshaping the models by clarifying some of the relationships within the water cycle. Greenland’s glaciers and Jason’s work will continue to be in the news throughout the International Polar Year and beyond.
This article was written by Carol Landis. For more information, see the Contributors page. Email Kimberly Lightle, Principal Investigator, with any questions about the content of this site.
Copyright August 2008 – The Ohio State University. This material is based upon work supported by the National Science Foundation under Grant No. 0733024. Any opinions, findings, and conclusions or recommendations expressed in this material are those of the author(s) and do not necessarily reflect the views of the National Science Foundation. This work is licensed under an Attribution-ShareAlike 3.0 Unported Creative Commons license.